Over-Fertilization: An Inverse Mitscherlich Process
H. Schneeberger
Institute of Statistics, University of Erlangen-Nürnberg, Germany
2009, 1stAugust
Abstract
The ascending part of the curve "crop-yield y in dependence on the quantity of fertilizer x" is the well-known Mitscherlich process. The following declining part of the curve after the maximum is an ascending curve too, if seen in dependence on the inverse variable u=-x, the variable of de-fertilizing or desalination. It will be shown, that this ascending curve in u is a (so-called inverse) Mitscherlich process too. Substituting in this formula for u the original variable x, we get a simple exponential formula in x for the declining part of the crop-yield curve.
The sequence of these two processes is well-known in mechanics of steel and concrete. The coincidence of data and hypotheses there is much better than in agronomy, as the experimental conditions are incomparably better. So those results could be used as pilot-study for this agronomic application.
Keywords: Mitscherlich process; inverse, exponential process.
Introduction
Mitscherlich (1909) introduced for the ascending part of the fertilizer-yield curve his hypothesis in the especially instructive form of a differential equation:
(I) ![]() (1)
(1)
where x is the quantity of fertilizer, y1 the experimental crop-yield, ![]() 1 (as usual in statistics) the hypothetical crop-yield, a1 the maximum yield and b1>0 the factor of proportionality. Hypothesis (I) means, that the increase d
1 (as usual in statistics) the hypothetical crop-yield, a1 the maximum yield and b1>0 the factor of proportionality. Hypothesis (I) means, that the increase d![]() 1/dx of crop-yield with increasing fertilizer x is proportional to a1-
1/dx of crop-yield with increasing fertilizer x is proportional to a1-![]() 1 with factor b1>0.
1 with factor b1>0.
With boundary condition ![]() 1(x=0)= c1 we have as solution of equation (1) Mitscherlich's formula:
1(x=0)= c1 we have as solution of equation (1) Mitscherlich's formula:
(I)![]() (2)
(2)
c1 is the crop-yield without fertilizing (x=0). An useful equivalent formula is according to Baule (1918)
![]() (2a)
(2a)
xA is solution of ![]() 1(xA)=0 (see figure 1, curve I).
1(xA)=0 (see figure 1, curve I).
As curve (I) ends with a horizontal asymptote, it is obvious, that hypothesis (2) cannot explain the declining part of the fertilizer-yield curve after the maximum. Numerous hypotheses from several authors have been proposed to solve this problem. All these approaches use one single function to describe the ascending and the declining branch of the curve. Already Mitscherlich himself modified the law (2a) with an exponential multiplicator (Mitscherlich 1928):
![]() k>0
k>0
and received a curve with the x-axis as asymptote (alike that in figure 2). In a later paper Mitscherlich (1948) published results of experiments with fertilizer x=N and crop y= rye, oats and wheat. The x-values for all three experiments were x=0, 0.3, 0.4, 0.5, 0.6 (100 kg/ha). For these x-values all five data-points (x,y) were on the ascending branch of the curve, the declining part of the curve was tested by the data not by a single experimental point! Statistically a non-acceptable procedure. Pesek (1994) stated this with the sentence: Mitscherlich did modify his basic equation (2) to the account of this (the declining yield with excessive applications of nutrients), but it was hardly ever used in estimating economic levels of fertilizer use.
In a paper Mitscherlich (1928) also discussed approaches of other authors. He writes: It is obvious, that the fertilizer-yield curve cannot have a parabolic character - as it is the idea of Gerlach, Seidel, Günther, Niklas and others. For then with maximum fertilizing we would get negative crop-yield. In similar manner he rejects the approach of Boresch, namely hyperbolic curves.
Heady et al. (1955) made extensive experiments with three nutrients P2O5, K2O, and N (ammonium nitrate) and three crops: corn, alfalfa and red clover and the following approaches:
- y = a + bx + cx2 linear/parabolic function
- y = c + x2 parabolic function
- y = axb power function
- y = a + bx + c
 linear/square-root function
 - y = a + bx + cx2+d mixed function
The authors came to the result: "No one algebraic form of equation was best for each separate set of observations".
Materials and Methods
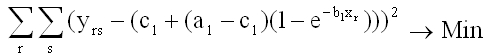
At the University of Technology München (Weihenstephan)/Germany in 2005 an experiment with y= winter-wheat and nutrient x=N was carried out. The data-points (xr, yrs) in table 1 very well show a declining tendency after the maximum, so that they are well apt for an analysis. Fortunately for each x-value four y-values were given (see table 1). For clearer demonstration the points (xr, ![]() ) with the means
) with the means ![]() are given in table 1 and in figure 1 (as stars). The data (xr, yrs) , (r=1,...,7; s=1,...,4), marked with (I), represent the ascending part of the process, the (xr, yrs), marked with (II), the declining part.
are given in table 1 and in figure 1 (as stars). The data (xr, yrs) , (r=1,...,7; s=1,...,4), marked with (I), represent the ascending part of the process, the (xr, yrs), marked with (II), the declining part.
| (I) Ascending part of the fertilizer-yield curve | |||||||||
| r | 1 | 2 | 3 | 4 | 5 | 6 | 7 | ||
| s | xr | 0 | 40 | 60 | 80 | 100 | 120 | 140 | |
| yrs | |||||||||
| 1 | 72.7 | 89.6 | 91.6 | 103.0 | 108.6 | 110.2 | 104.1 | ||
| 2 | 60.9 | 86.4 | 91.6 | 102.6 | 101.0 | 96.9 | 105.6 | ||
| 3 | 60.6 | 91.1 | 96.6 | 100.4 | 103.6 | 102.5 | 105.4 | ||
| 4 | 58.3 | 79.8 | 108.8 | 109.2 | 111.3 | 118.3 | 110.8 | ||
| 63.12 | 86.72 | 97.15 | 103.8 | 106.12 | 106.97 | 106.47 | |||
| (II) Declinig part of the fertilizer-yield curve | |||||||||
| r | 1 | 2 | 3 | 4 | 5 | 6 | 7 | ||
| s | xr | 180 | 200 | 200 | 220 | 240 | 260 | 300 | |
| yrs | |||||||||
| 1 | 99.9 | 107.4 | 106.2 | 109.5 | 93.5 | 87.0 | 85.7 | ||
| 2 | 94.9 | 103.5 | 113.6 | 100.3 | 95.9 | 82.9 | 85.0 | ||
| 3 | 104.1 | 105.9 | 111.2 | 108.9 | 98.1 | 89.5 | 86.8 | ||
| 4 | 108.4 | 94.6 | 100.6 | 101.5 | 96.6 | 90.5 | 83.1 | ||
| 101.82 | 102.85 | 107.9 | 105.05 | 96.02 | 87.47 | 85.15 | |||
I. The ascending part of the fertilizer-yield curve with data (I) of table 1.
The parameters a1, b1 and c1 of Mitscherlich's curve (2) are estimated with the method of Least Squares of Gauss:
 (4)
(4)
The optimum parameters a1, b1 and c1 were found with the iterative Nonlinear Simplex Method of Nelder and Mead (1965). See also Schneeberger (2009).
II. The declining part of the fertilizer-yield curve with data (II) of table 1.
In the region (I) we have a process of increasing crop-yield (dy>0) with increasing fertilizing (dx>0), given by formula (1): Mitscherlich's formula.
In region (II) we have increasing crop-yield (dy>0) with increasing de-salination (du=-dx>0). See figure 1. So the hypothesis again is Mitscherlich's formula:
(II) ![]() (5)
(5)
with u = x0 - x, where x0 is an arbitrary value on the x-axis in the region of validity of hypothesis (II), e.g. x0 = 300 kg/ha. Equation (II) means, that d![]() 2/du is proportional to a2 - y with factor b2. I will call (II) "Inverse Mitscherlich's Formula", u inverse variable.
2/du is proportional to a2 - y with factor b2. I will call (II) "Inverse Mitscherlich's Formula", u inverse variable.
Then we have with boundary condition ![]() 2(u = 0) =
2(u = 0) = ![]() 2 (x = x0) = c2 in analogy with Mitscherlich's formula (2) the solution of differential equation (5):
2 (x = x0) = c2 in analogy with Mitscherlich's formula (2) the solution of differential equation (5):
(II)![]() (6)
(6)
or with u = x0 - x
![]() (7)
(7)
As we have with formula (6) - see figure 1
|
|
|
| we get | |
| and herewidth |
|
independent of x0!
The final result of curve (II) in the original variable x is the simple exponential process:
(II)![]() (9)
(9)
The parameters a2, b2 and xB of formula (9) are again computed with the Nonlinear Simplex-Method of Nelder and Mead and the data (II) of table 1.
It will be shown in the appendix, that the parameters a1 of formula (2) and a2 of formula (9) are identical:
![]() (10)
(10)
This hypothesis is the link between process (I) and (II).
Hypothesis (10) hardly could be anticipated with the agricultural data of table 1 because of the great variance of the data-points (x,![]() ) - see figure 1. This would be still more evident with the original data (x,y).
) - see figure 1. This would be still more evident with the original data (x,y).
By chance a short time ago the author worked on a problem in technical mechanics: the stress-strain relation of steel and concrete. It will be shown in the Appendix (Schneeberger 2005), that the formulae for the fertilizer-yield relation and the stress-strain relation in techniques are identical. But there are immense advantages in the analysis of the technical data. The experiments can be repeated with the same conditions; these conditions can be selected and held constant; the time of an experiment is much shorter, the experiments are cheaper and perhaps the most important fact for the analysis: the material, especially steel, is much more homogenous than in agronomy. The consequence is, that the data-points vary much less around an hypothetical curve than in agronomy. So it is much easier to anticipate hypotheses. In short: The stress-strain relation in techniques may function as a pilot-study for the fertilizer-yield relation.
Results and Discussion
I. For the ascending curve (2) of our agronomic problem we get the parameters
![]()
and herewith
![]()
II. For the descending curve (9) we get the parameters
![]()
and herewith
![]()
Curves (I) and (II) are given in figure 1. The data-points (x,![]() ) are given as stars.
) are given as stars.
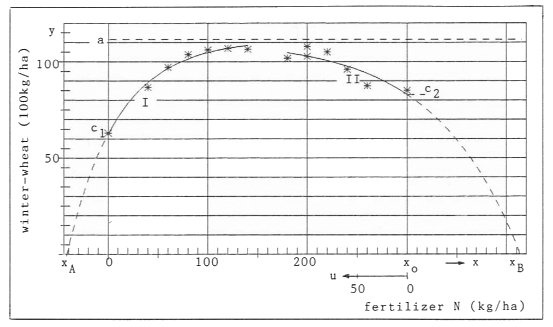
Figure 1 Ascending part ![]() 1 (=I) and declining part
1 (=I) and declining part ![]() 2 (=II) of the fertilizer-yield curve
2 (=II) of the fertilizer-yield curve
Curve (II) is extrapolated as dotted line from x0 = 300 (the last data-value) to x B = 413.7 (N in kg/ha) with ![]() 2(xB) = 0. As there are no data-points in this section, it cannot be claimed, that hypothesis (II) is valid up to this end x = x B, or up to what value x < x B and what other hypothesis is valid afterward.
2(xB) = 0. As there are no data-points in this section, it cannot be claimed, that hypothesis (II) is valid up to this end x = x B, or up to what value x < x B and what other hypothesis is valid afterward.
In the appendix assumptions on this problem are given.
APPENDIX
The Stress-Strain Relationship in Mechanics
The (approximate) solution of this problem is the long-known Law of Hooke (1660)
![]()
(ut tensio, sic vis), which means, that the stress y (= σ in mechanics) is proportional to the strain x (= ε). This approximation is valid only for smaller values of loading σ.
Numerous experiments were made at the University of Technology in München (Rüsch 1955, Rasch 1962) with concrete and in Aachen (Dahl/Rees 1976) with steel to generalize Hooke`s Law for high loading and in consequence to refute a supposition of Galilei (1564-1642). The mathematical analysis of these data resulted in the so-called Generalized Hooke's Law (Schneeberger 2005 and 2002):
(I) ![]()
for the ascending part (I) of the stress-strain curves (see figures 2 and 3). This formula is identical with Mitscherlich's Law (2) for c1 = 0 and can also be found in quite different disciplines of natural sciences, e.g. as Mendel's Law of genetics, etc. Hooke's approximation simply results from the generalization (I) by writing e -b1x as an infinite Taylor-series and breaking off after the first (linear) term in x, which yields ![]() 1 = a1b1x = κ · x.
1 = a1b1x = κ · x.
The hypothesis for the declining part of the stress-strain curve is (Schneeberger 2005)
(II) ![]()
(cf. formula (9)). Fortunately for concrete the experiments were carried out to the end, until destroying. The hypothesis for this third last part of the stress-strain curve, beginning at the point of inflection, is (Schneeberger 2005):
(III)![]()
the well-known exponential dying-process (e.g. radioactive decay).
A. Pressure experiment with concrete (Rasch 1962). We got
| (I) | |
| (II) | |
| (III) |
One can see in figure 2, that the data-points (stars) very well correspond with the curves (I), (II) and (III), much better than in the fertilizer-yield case of figure 1. The question, if the curves in figure 1 also end with an exponential process of type (III) could only be tested with agricultural experiments, which would be carried out until the dying of the soil, i.e. until the yield y is zero. It seems, that Mitscherlich had the imagination of such an end. For this see the figures in his paper (Mitscherlich 1948).
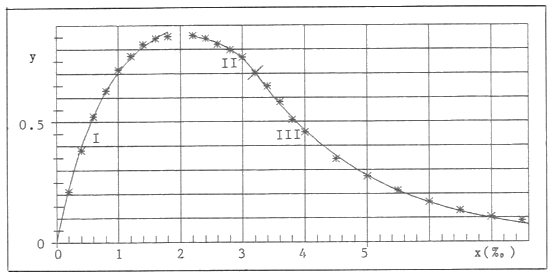
Figure 2 Stress-strain curve of concrete (stars are data-points)
B. Tension-experiment with steel in the region of strain-hardening (I) before the maximum and in the region of the reduction area (II) after the maximum.
To the steel-experts, who gave these names, it obviously was clear, that the stress-strain character of the material had changed. The consequence is another mathematical relationship!
Here an example with extreme conditions: Temperature T = -150° C; cooling with liquid nitrogen (Dahl/Rees 1976). We got (y in Newton/mm2)
| (I) | |
| (II) |
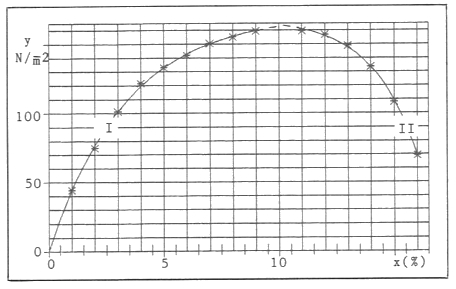
Figure 3 Stress-strain curve of steel (stars are data-points)
With the especially homogenous material steel the correspondence of data (stars in figure 3) and the hypotheses (curves) is especially good. For the parameters a1 and a2 we got 171.4 and 168.1. For a second example with T = 0° C we got a1 = 169.3 and a2 = 168.5. For more examples this is similar. This fact resulted in the hypothesis a1 = a2 = a (formula (10)).
For steel also the transition of process I to process II fits tightly.
Unfortunately the numerous experiments with steel were broken off before the end, before destroying. So no founded hypothesis can be made, if the experiments end with process (II), or with process (III), or in some other way. Because of the pilot-character especially of the experiments with steel this must be regretted.
Acknowledgement
I have to thank Dr. Maidl of the University of Technology München (Weihenstephan) for providing me with the data, used in this article (table 1).
A generalization with two fertilizers is given in paper 5 (Paper 5: Mitscherlich's Law: Generalization with several Fertilizers and Overfertilization.)
References
Baule, B. (1918): Zu Mitscherlich's Gesetz der physiologischen Beziehungen. Landwirtschaftliche Jahrbücher 61, 363-385.
Dahl, W. and Rees, H. (1976): Die Spannungs-Dehnungs Kurve von Stahl. Verlag Stahleisen, Düsseldorf.
Heady, E.O., Pesek, J.T. and Brown, W.G. (1955): Crop Response Surfaces and Economic Optima in Fertilizer Use. IOWA State College.
Mitscherlich, E.A. (1909): Das Gesetz des Minimums und das Gesetz des abnehmenden Bodenertrags. Landwirtschaftliche Jahrbücher 38, 537-552.
Mitscherlich, E.A. (1928): Die zweite Annäherung des Wirkungsgesetzes der Wachstumsfaktoren. Zeitschrift für Pflanzenernährung und Bodenkunde, 273-282.
Mitscherlich, E.A. (1948): Die Ertragsgesetze. Deutsche Akademie der Wissenschaften Berlin, Heft 31.
Nelder, J.R. and Mead, R. (1965): A Simplex Method for function minimization. The Computer Journal 7, 303-313.
Pesek, J. (1994): Isoclines and Isoquants: Expansion Paths and Substitution Rate. In: Longley J., Vocke G. and Whiting L. (eds.): O. Heady: His impact on agricultural economics, 62-75.
Rasch, CH. (1962): Spannungs-Dehnungs Linien des Betons und Spannungsverteilung in der Biegedruckzone bei konstanter Dehngeschwindigkeit. Deutscher Ausschuss für Stahlbeton, Heft 154.
Rüsch, H. (1955): Versuche zur Festigkeit der Biegedruckzone. Deutscher Ausschuss für Stahlbeton, Heft 120.
Schneeberger, H. (2002): The distribution of the stress in the cross-section of a beam: A problem of Galilei. In: R.K. Dhir, P.C. Hewlett and L.J. Csetenyi (eds.): Innovations and developments in concrete materials and construction. Proceedings of the International Conference at the University of Dundee, UK, 699-708.
Schneeberger, H. (2005): Theory of the stress-strain relation of concrete and steel. In: R.K. Dhir, M.D. Newlands and L.J. Csetenyi (eds.): Application of Nanotechnology in Concrete Design. Proceedings of the International Conference at the University of Dundee, Scotland, UK, 105-112.
Schneeberger, H. (2009): Mitscherlich's Law: Sum of two exponential Processes. Conclusions. Internet: "www.soil-statistic.de", paper 1.